
How to Review AI-Generated Charts Before Publishing
Reviewing AI-generated charts starts with matching plotted values to the underlying data and independently reproducing calculations. A polished graphic and a confident explanation provide no evidence that the numbers are correct.
Editors must separate numerical accuracy from design and accessibility. A chart can pass one review and fail another, so publication requires both. The review begins with a tool that exposes its data and transformations.
Key Takeaways
Match plotted values, totals, dates, and metric definitions to the source, rather than accepting the model's explanation.
Treat incorrect calculations and misleading visual design as separate failures that both prevent approval.
Retain the source file, transformations, prompt, and approved export so another reviewer can reconstruct the result.
Choose an AI Chart Tool That Exposes Its Work
Choose an AI chart generator that exposes its source values and transformations so editors can inspect the calculations behind a chart. Credit allowances matter less when the output conceals its source values.
A quantitative graph maker charts measured values, while a flowchart maps process steps. The two tools aren't interchangeable.
Typed prompts: ChartAI and ChartGPT
Piktochart's chart-tool roundup lists ChartAI with five free credits and ChartGPT with three. Both suit small charts built from pasted values rather than spreadsheet uploads.
Their central review risk is transcription: omitted categories, altered values, or a prompt that never defines the metric.
Spreadsheet analysis: Julius, AppyPie, and Excel
Piktochart, Julius AI, and AppyPie support Excel data and CSV file inputs. AppyPie has a basic free version, with premium plans starting at $7.99 monthly.
Piktochart's reported Julius AI allowances are 20 free credits, $17.99 monthly for 250 messages, $37.99 for unlimited messages, and $49.99 for Pro. However, Julius's pricing page now describes daily free credits and credit-based plans. The roundup's message allowances aren't a reliable description of the current offer.
Microsoft 365 Copilot's enterprise license costs $30 per user monthly on an annual commitment, alongside an eligible Microsoft 365 subscription. Copilot in Excel suits workbook-based analysis because reviewers can retain the table and chart together.
Connected-data dashboards
Tableau Einstein Copilot, Power BI Copilot, and Looker with Gemini support natural-language analysis and chart or report creation from connected data. Their licensing and capacity requirements differ.
A recurring dashboard needs more than a correct initial image. Reviewers must examine refresh timing, shared filters, metric definitions, and whether later data changes preserve the approved calculation.
Define the Decision and Prepare the Data
Establish the question before choosing a chart
A chart should answer a defined question: whether traffic changed, which category contributed most, or how two variables relate. That decision determines the comparison and chart type.
A line chart suits ordered time series. A bar chart compares categories, while a scatter plot shows relationships between numerical variables. A pie chart requires mutually exclusive parts of a meaningful whole.
The brief should define the metric, reporting period, population, and aggregation. These boundaries make the subsequent data analysis interpretable. "Revenue" is insufficient when the spreadsheet contains gross sales, refunds, and net revenue.
Preserve the source before cleaning it
Keep an unchanged source file, then prepare a separate charting table. Remove empty rows, assign descriptive column headers, and retain one row per observation.
Next, inspect duplicates, missing values, mixed currencies, and inconsistent date formats. A blank value doesn't automatically mean zero. Likewise, repeated transactions may be legitimate observations rather than duplicates.
Record the file version, extraction date, row count, and applied filters. If cleaning removes records, retain the exclusion rule and affected count. These details explain why the chart's population may differ from the original download.
Write a Prompt That Can Be Audited
An AI chart maker can interpret requests in natural language. A useful text prompt still specifies the chart type, variables, date range, and aggregation. Include formatting details for chart customization, such as units, date formats, and label treatment.
Using only the supplied spreadsheet, plot monthly website sessions for January through June. Sum sessions by calendar month. Show conversion rate in a separate aligned panel, calculated as total conversions divided by total sessions. Label units and disclose missing months. Return the aggregated table and transformation steps. Don't invent values or interpolate gaps.
This request creates reviewable outputs: a chart, its plotting table, and the calculation method. The reviewer still needs to reproduce that method independently.
Although the instructions can request traffic and conversion rate on a secondary axis, separate panels reduce the risk of a misleading comparison. Different axis ranges can make unrelated movements appear closely aligned.
The instructions should also prohibit unsupported interpretations. A change after a campaign doesn't establish that the campaign caused it, even when the chart's timing looks persuasive.
Check AI-Generated Charts Against the Source
Reconcile plotted values and categories
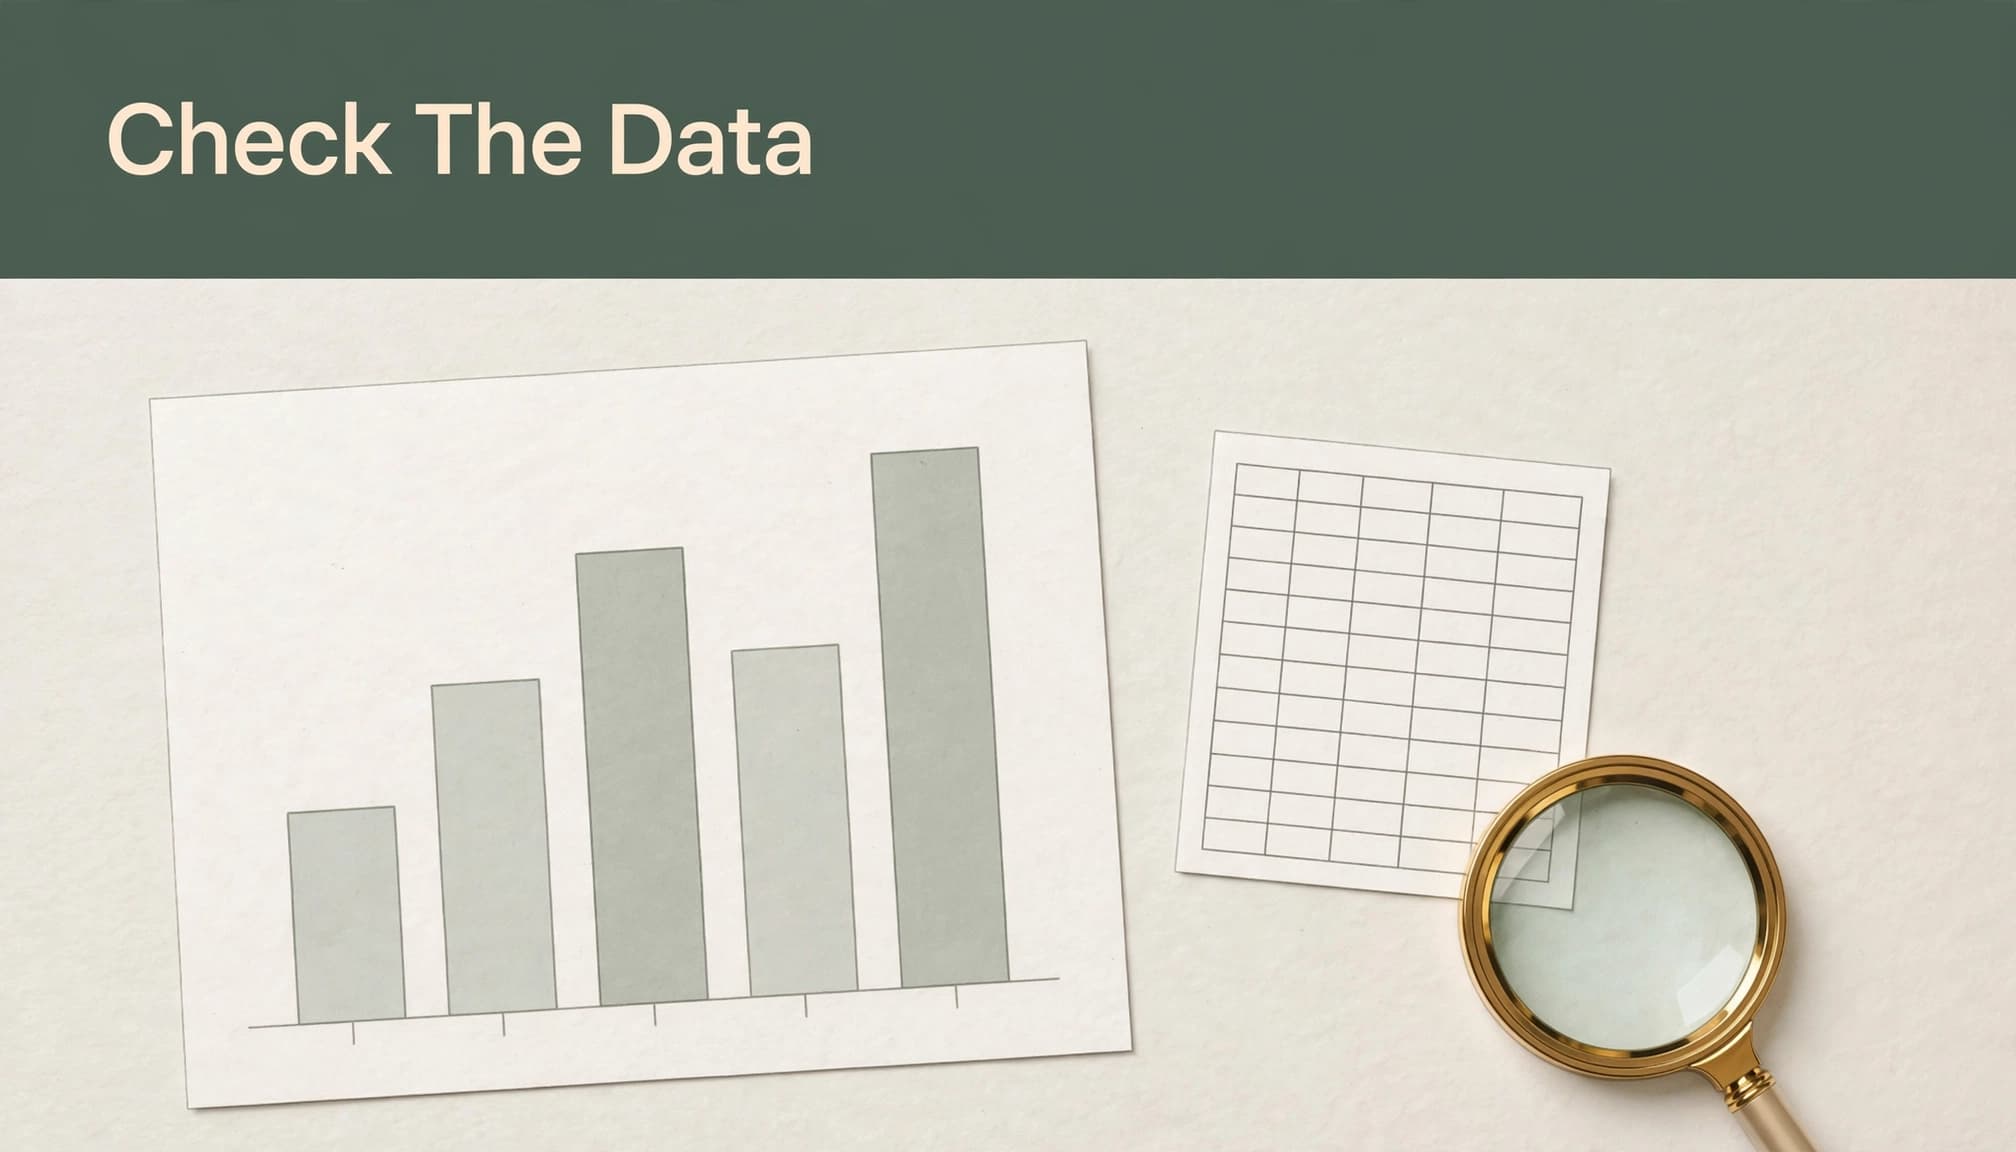
Treat an AI graph generator's plotting table as an output to verify, not an authoritative source. Compare it with the original records, not merely with the AI's summary. Confirm the selected columns, especially easily confused pairs such as gross versus net revenue or orders versus customers.
Then reconcile every category and period. Check totals, exclusions, sort order, and duplicate handling. Dates require particular care: month/day ambiguity, fiscal periods, and time-zone boundaries can move observations between groups.
For small charts, inspect every value. For larger datasets, compare all aggregates programmatically or with a pivot table. Spot-checking alone can miss a systematic error affecting an entire segment.
Recalculate derived metrics independently
Reproduce sums, averages, percentages, and growth rates in a spreadsheet or calculator. Python code is also an option when it's independently reviewed and run against the source data. A second ChatGPT explanation isn't independent verification.
Rates need the correct denominator. Monthly conversion rate should normally use total conversions divided by total sessions, rather than an unweighted average of daily rates.
Also distinguish percentage points from relative change. An increase from 10% to 15% equals five percentage points, or a 50% relative increase.
Finally, compare displayed rounding with the underlying precision. Rounded components may not add exactly to a displayed total; any meaningful discrepancy needs explanation.
Our AI content QA rubric applies the same evidence-first standard to accompanying prose. A caption must preserve the chart's denominator, period, and limitations.
Review Design and Accessibility Separately
Examine axes, labels, and visual claims
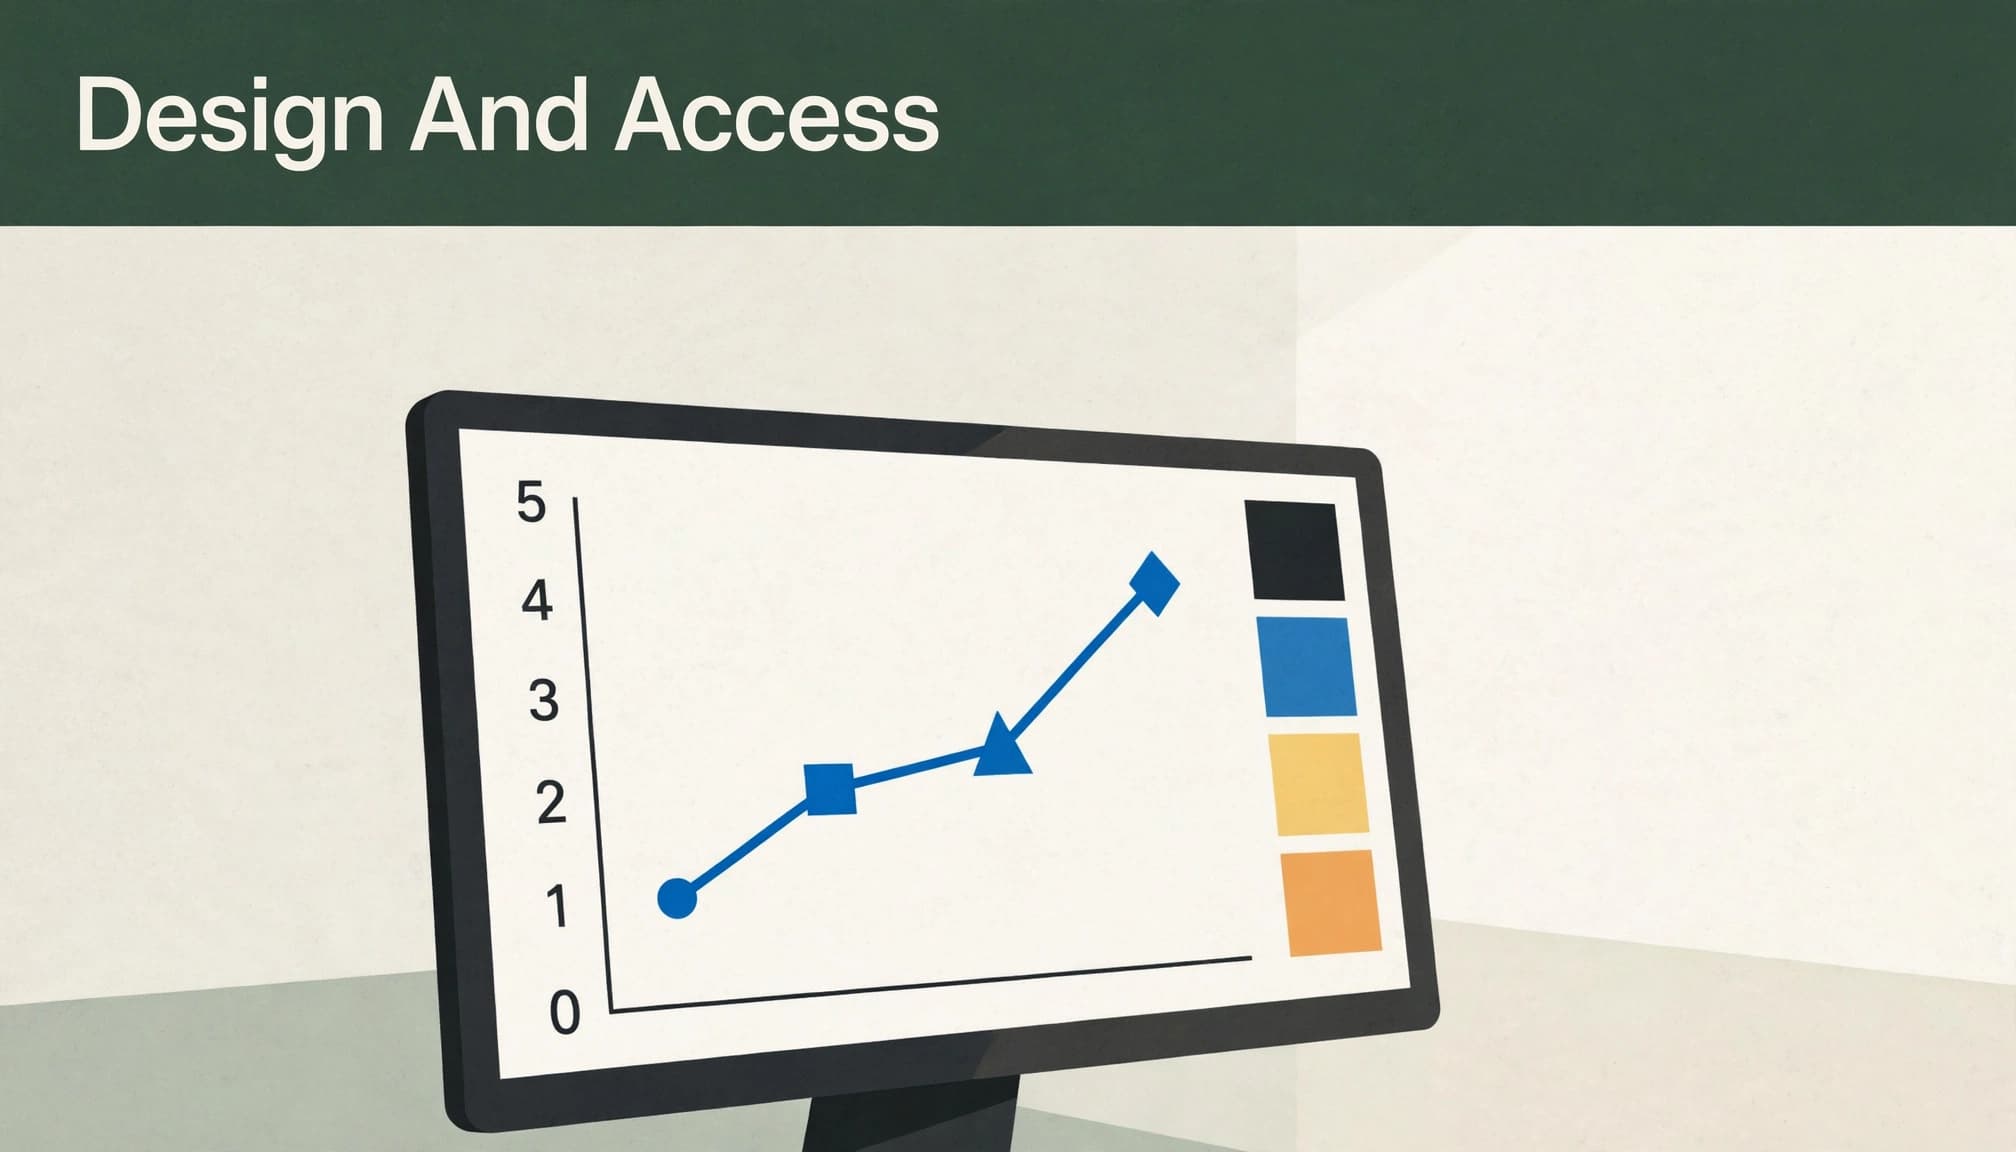
Correct numbers can still produce a misleading data visualization. Bar and area charts generally need a zero baseline because their lengths or filled areas encode magnitude. The Urban Institute's visualization guidance supports this baseline discipline.
Nonzero line-chart baselines can reveal changes in rates or narrow ranges, but the scale must remain obvious. Rates don't provide a blanket exemption for truncated bars.
Review tick intervals, logarithmic scales, units, and category spacing. Avoid dual axes when separate panels communicate the comparison clearly. Titles also need scrutiny: "surge" or "collapse" may exaggerate modest movement.
Test comprehension beyond color
Distinguish series with direct labels, marker shapes, or line patterns as well as color. Inspect text at the final publication size, including on mobile.
Provide alternative text that communicates the chart's purpose and principal finding. A nearby data table or longer description should preserve the values and qualifications that a short description can't contain. Our accessibility editing guidance addresses this context-dependent review.
Research by Kim, Ahn, Myers, and Bach found that ChatGPT produced more chart suggestions faster, but practitioners preferred human experts' advice. Generating options quickly doesn't settle which visual judgment fits the evidence.
A Concise Pre-Publication Checklist
The final gate should assess the exported artifact, not just the editable preview.
Match the chart to the approved source version, population, reporting period, and metric definition.
Reconcile plotted values and totals, then independently reproduce every derived measure.
Confirm dates, filters, missing values, units, source columns, and aggregation rules.
Inspect chart type, axis baselines, scales, labels, and titles for misleading implications.
Test readability, non-color distinctions, alternative text, and access to the underlying values.
Open the final export, check for clipped labels or lost qualifications, and record human approval.
Unresolved numerical mismatches should stop publication. A visually attractive result cannot compensate for an incorrect denominator.
Retain the prompt, source snapshot, transformations, reviewer decisions, and approved file. Our editorial version-history guidance explains how named checkpoints preserve a usable review trail.
Frequently Asked Questions
Are AI-generated charts accurate?
They can be, but accuracy depends on source quality, transformations, and correct plotting. Generative systems can select the wrong column, calculate incorrectly, or introduce unsupported values. Visual plausibility and a reassuring explanation don't establish accuracy.
Is it safe to upload confidential spreadsheets?
Data privacy depends on using an approved environment with defined access, retention, and contractual protections. Public prompts shouldn't contain identifiable customer, employee, financial, or research records. Removing names alone may leave people identifiable through dates, locations, or unusual details.
Which export format works best?
PNG suits presentations and fixed-size images. SVG suits scalable web graphics, while PDF suits print layouts. These are format choices, not universal feature guarantees across tools. Review the actual export for legibility, missing labels, and preserved qualifications; exporting a PDF doesn't automatically make it accessible.
Publication Depends on Traceable Evidence
AI-generated charts deserve the same scrutiny as any other published numerical claim. Their values must reconcile with a source, and their visual form must communicate that evidence without distortion.
The strongest safeguard is reproducibility: another reviewer can identify the input, repeat the calculation, and reach the same result. A convincing appearance cannot supply that chain of evidence.